📊 Monitoring
On the Stats tab, you can comprehensively monitor the status of your API key in real time based on the following dimensions: credit usage, request distribution of top 5 API methods, request status, and request sources. Status monitoring helps you keep abreast of the use and quickly respond.
Overview
Real-time monitoring, all under your control.
The node service allows you to comprehensively monitor API key status in real time. Specifically, the following modules can be monitored:
- Credit usage fluctuation monitoring
Monitors the resource consumption of the current API key within the last 24 hours. - Request distribution of top 5 API methods
Provides call information and proportion distribution of top 5 API methods that are ranked based on the number of requests within the last 15 minutes, 1 hour, 1 day, 7 days, and 30 days. - Request error monitoring
Provides information about all call requests within the last 15 minutes, 1 hour, 1 day, 7 days, and 30 days, including the status codes to highlight the causes of request failures. - Source monitoring
Provides information about the sources from which API method requests are made by using the API key within the last 15 minutes, 1 hour, 1 day, 7 days, and 30 days.
View path
- Log in to the ZAN Node Service Console and click on Chain RPC in the left navigation bar.
- Switch to the Metrics tab, where you can comprehensively monitor the metrics of the API key in real time.
Monitoring credit usage
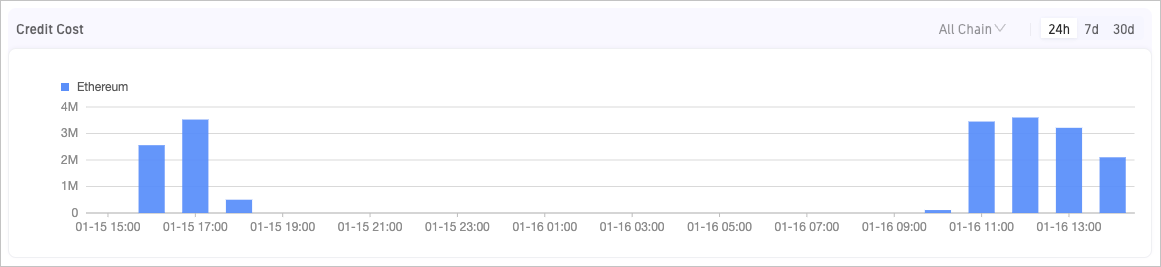
The Credit Cost (Last 24 hours) module monitors the number of credits that have been consumed by using the API key within the last 24 hours and collects the data at an interval of 1 hour.
Monitoring the request distribution of the top 5 API methods
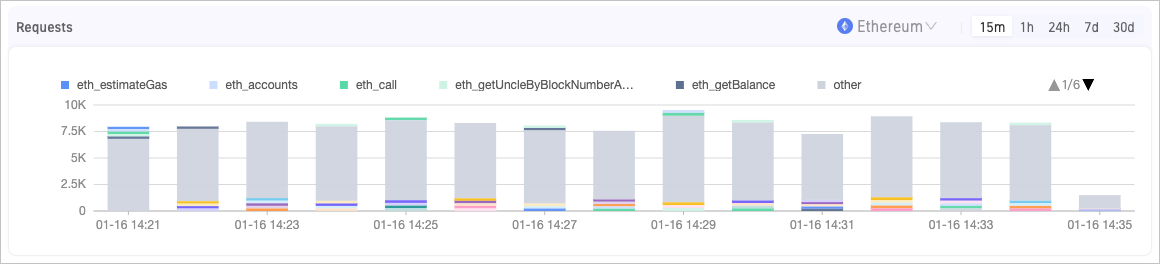
The Requests module provides the call information and proportion distribution of the top 5 API methods that are ranked based on the number of requests within the last 15 minutes, 1 hour, 1 day, 7 days, and 30 days.
In the bar chart, each color block represents the number of requests to an API method. The length of a bar represents the total number of requests at the corresponding point in time. Move the pointer over a bar. Then, you can view the proportion distribution of the top 5 API methods that are ranked based on the number of requests and the other API methods at the corresponding point in time.
Supported operations
- In the upper-right corner, you can specify a time range. You can specify 15 minutes, 1 hour, 24 hours, 7 days, or 1 month as the time range.
- In the upper-right corner, you can specify a blockchain that is supported by the platform.
- Click a method above the chart to disable the display in the chart. To enable the display, click the method again.
Monitoring request status
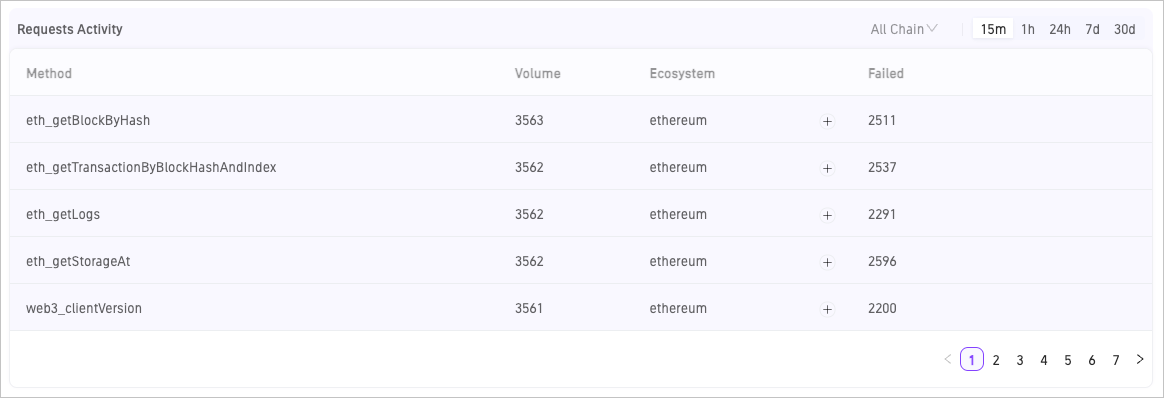
The Requests activity module provides information about all call requests within the last 15 minutes, 1 hour, 1 day, 7 days, and 30 days. This module also provides the status codes of failed requests to highlight the causes of failures.
Parameter description
- Method: The specific call method.
- Volume: The number of calls to the method.
- Failed: The number of failed requests.
After you expand the Failed column, you can view the statistics about the failed requests, including the status codes and the corresponding request volume. The number of HTTPS requests and the number of WebSocket Secure (WSS) requests are separately counted.
Supported operations
- In the upper-right corner, you can specify a time range. You can specify 15 minutes, 1 hour, 24 hours, 7 days, or 1 month as the time range.
- In the upper-right corner, you can specify a blockchain that is supported by the platform.
Monitoring request sources
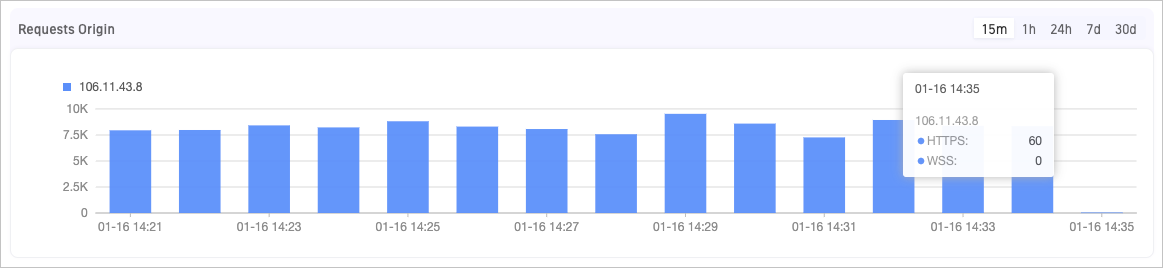
The Requests Origin module provides information about the sources from which API method requests are made by using the API key within the last 15 minutes, 1 hour, 1 day, 7 days, and 30 days.
In the bar chart, each color block represents a different source. Move the pointer over a bar. Then, you can view statistics about the number of calls from each source. The number of HTTPS calls and the number of WSS calls are separately counted.
Supported operations
- In the upper-right corner, you can specify a time range. You can specify 15 minutes, 1 hour, 24 hours, 7 days, or 1 month as the time range.
- Click a source IP address above the chart to disable the display in the chart. To enable the display, click the source IP address again.
Updated 5 months ago