Monitoring
API key Usage Monitoring.
Solana RPC Node Monitoring
The platform provides comprehensive data statistics for the Solana RPC Node, including Block Height (synchronized with the real-time block height of the official browser), Disk Usage, CPU Usage, Memory Usage, and Traffic Monitoring. Additionally, the platform offers alert notification services based on the block synchronization status, CPU, memory, and disk usage of the Solana RPC Node. Once configured, you can monitor these key metrics in real-time and receive immediate notifications in case of anomalies. Moreover, you can access all historical alert records at any time, facilitating issue tracking and performance analysis.
Statistical Analysis Module
-
Log in to the ZAN Node Service Console
-
Click on Dedicated Node on the left navigation bar.
-
On the Solana RPC Node tab, the Statistical Analytics module surfaces the following core performance metrics.\
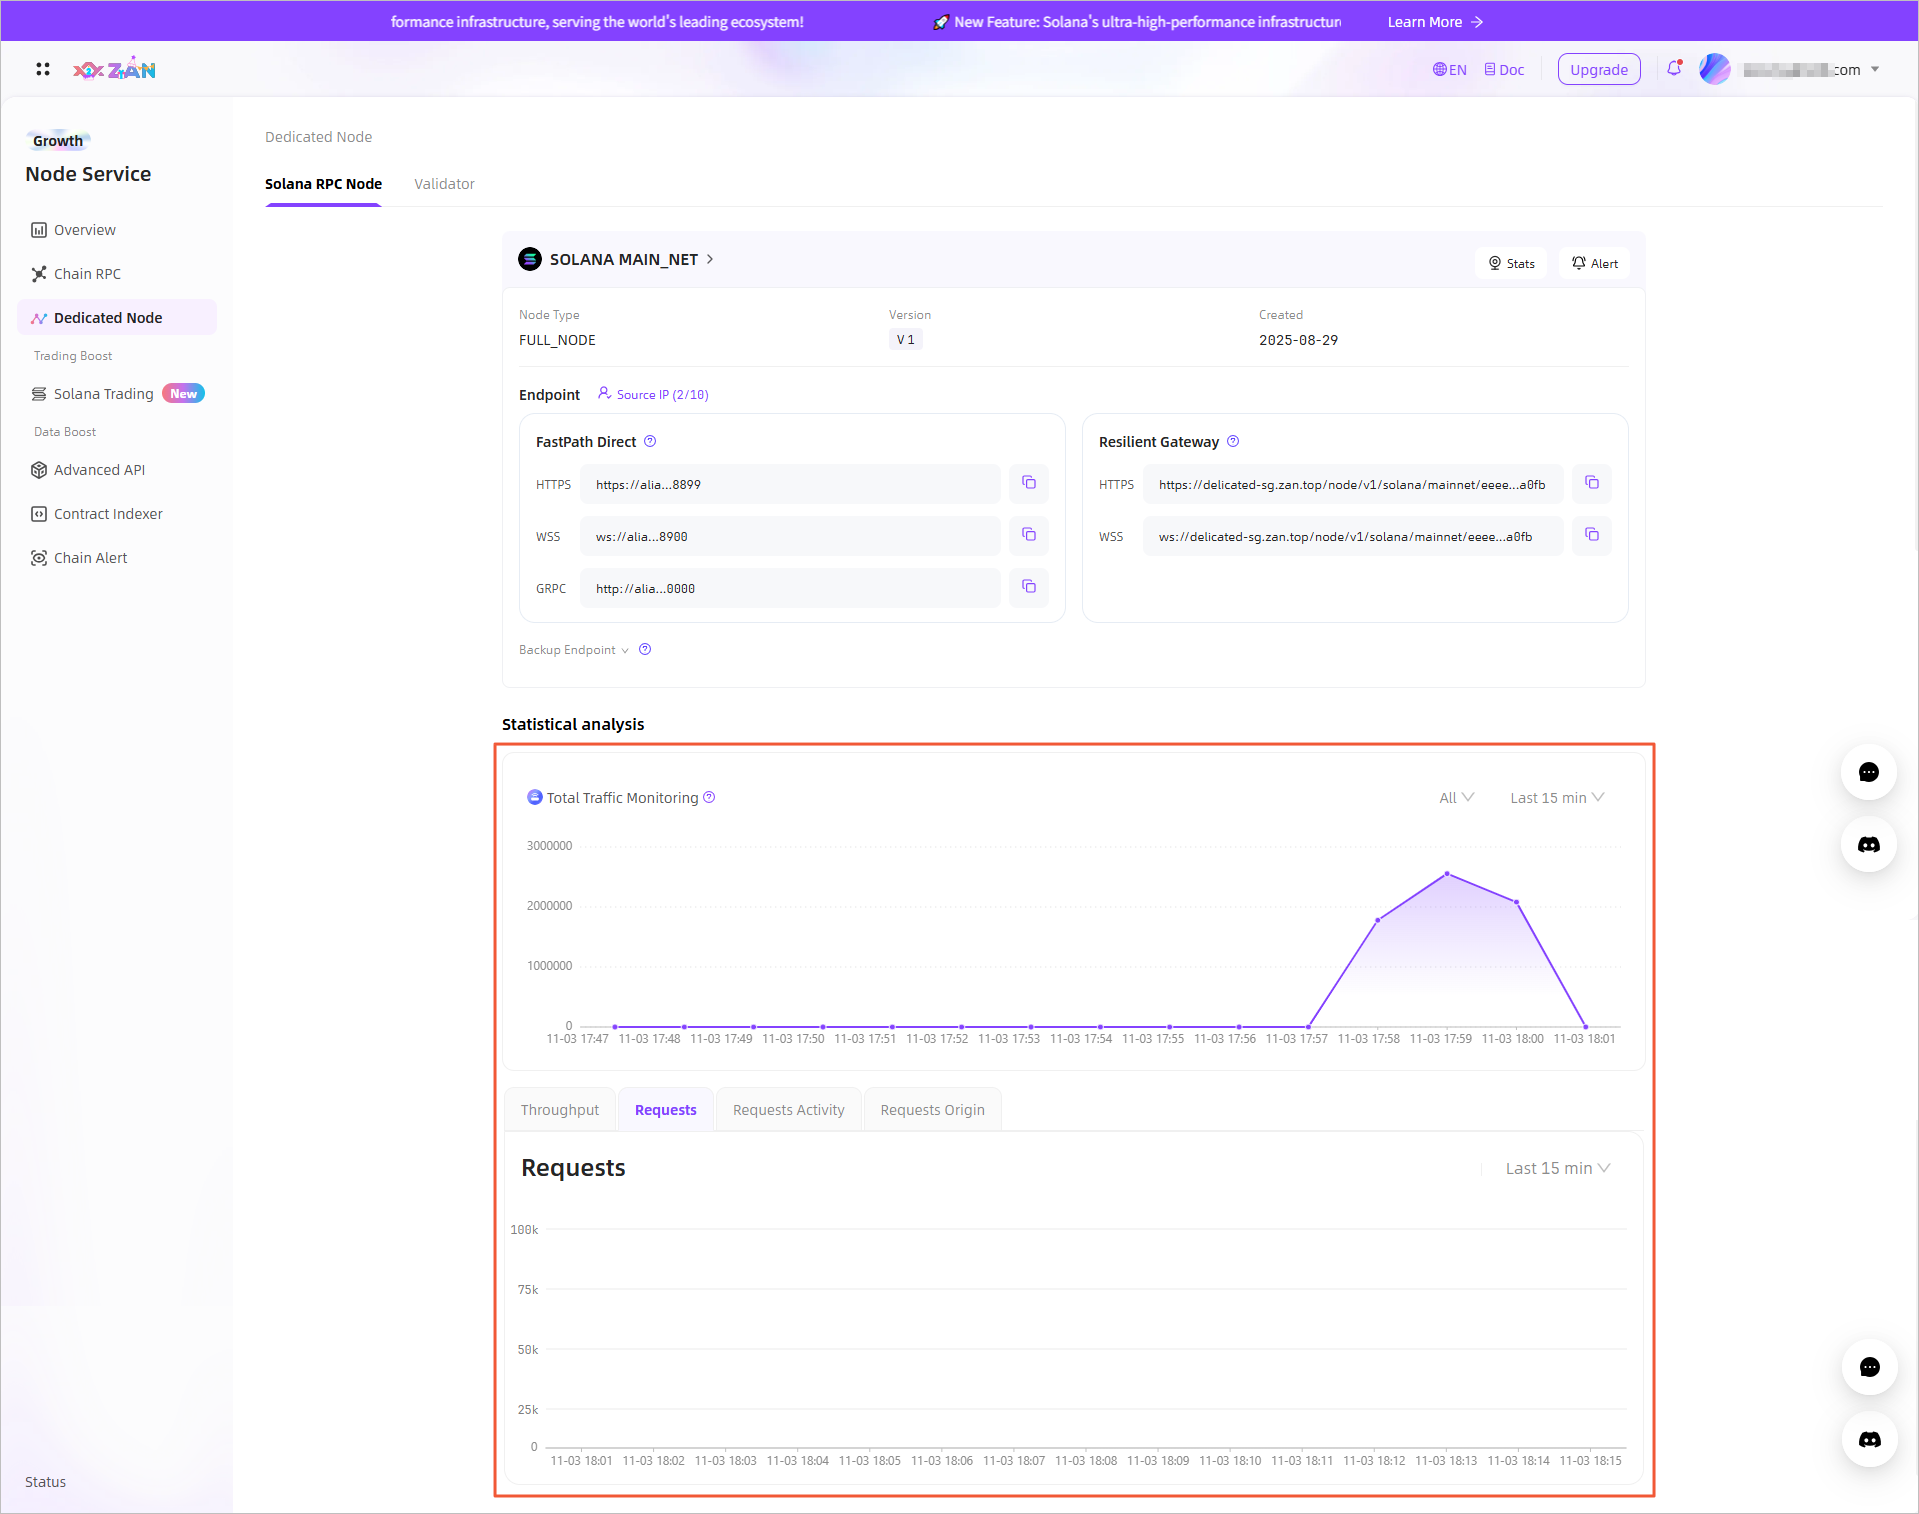
Metrics Description Traffic Monitoring Displays the traffic usage data for the Solana RPC node over the past week. Throughput Monitors the resource consumption of the current API key within the last 24 hours. Requests Provides call information and proportion distribution of top 5 API methods that are ranked based on the number of requests within the last 15 minutes, 1 hour, 1 day, 7 days, and 30 days. Requests Activity Provides information about all call requests within the last 15 minutes, 1 hour, 1 day, 7 days, and 30 days, including the status codes to highlight the causes of request failures. Requests Origin Provides information about the sources from which API method requests are made by using the API key within the last 15 minutes, 1 hour, 1 day, 7 days, and 30 days.
Other Statistical Information
- Log in to the ZAN Node Service Console and click on Dedicated Node in the left navigation bar.
- Under the Solana RPC Node tab, locate and click on the target node.\
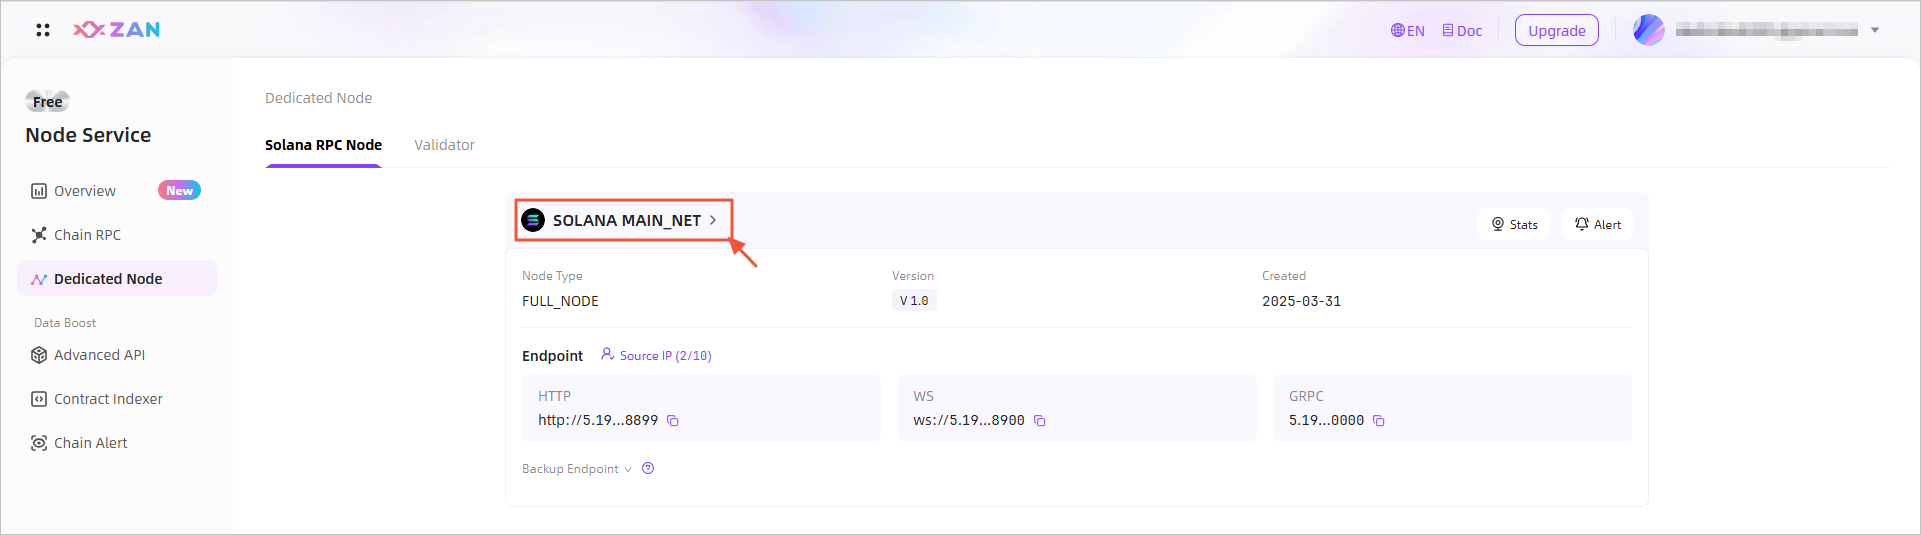
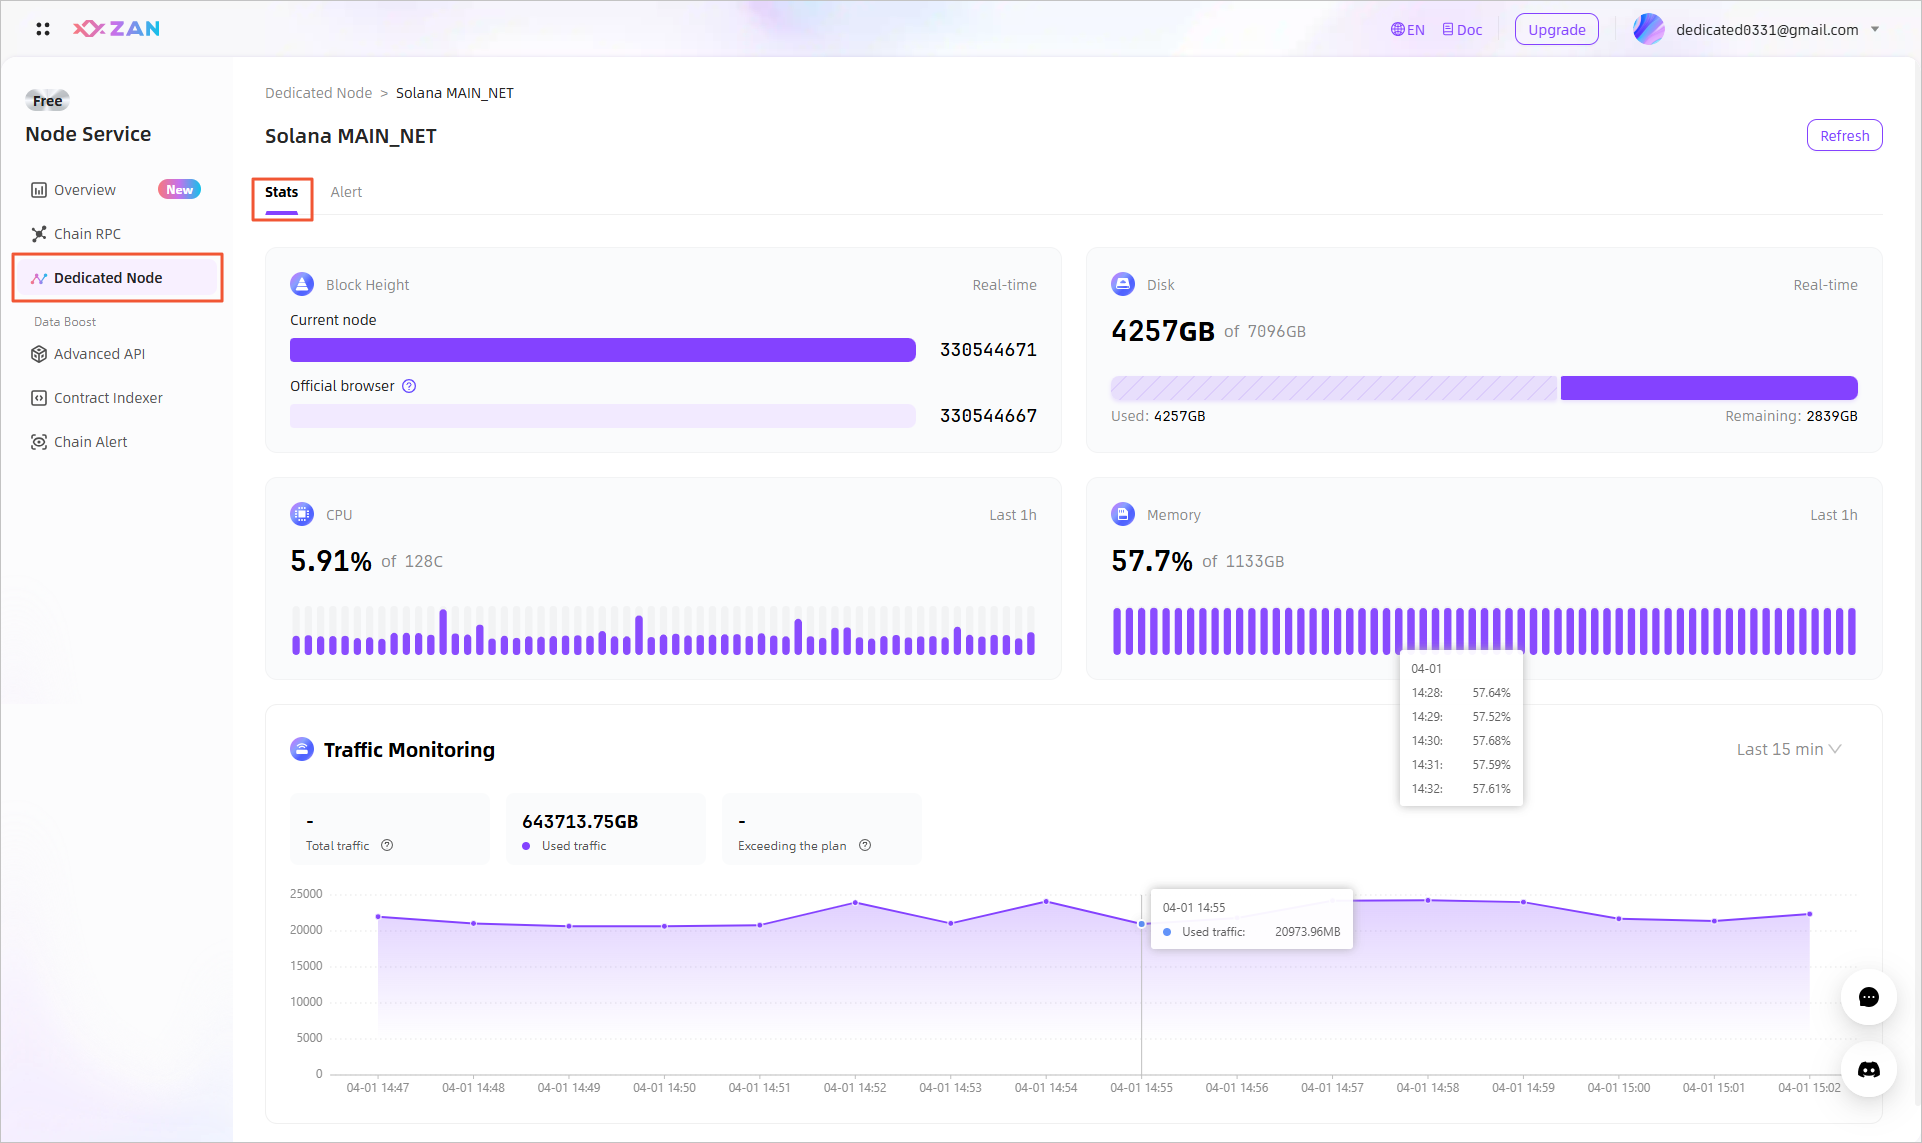
- On the node details page, statistical information under the default Stats tab will be displayed, as detailed below.\
| No. | Metric | Description |
|---|---|---|
| 1 | Block Height | Showcases the real-time block height of your current Solana RPC node, comparing it with the block height from the official Solana blockchain explorer to let you swiftly grasp the blockchain's sync status and block height discrepancies. |
| 2 | Disk | Real-time monitoring of your Solana RPC node's disk usage, detailing total capacity, used space, and remaining space. |
| 3 | CPU | Real-time monitoring of your Solana RPC node's CPU usage status, helping you promptly understand the node's operational status and performance bottlenecks. |
| 4 | Memory | Real-time monitoring of your Solana RPC node's memory usage status, ensuring stable node operation and early alerts for potential memory shortages. |
| 5 | Traffic Monitoring | Showcases your total traffic package volume, the amount of traffic used traffic, and the traffic exceeding your package limits. Additionally, it provides you with traffic usage trend charts for the last 15 minutes, 1 hour, 24 hours, and 7 days, helping you comprehensively understand your traffic consumption patterns.
|
Manage Alert Notifications
You can configure alert notifications for the block height synchronization status, CPU, memory, and disk usage of the Solana RPC Node. Once an alert is triggered, you can receive timely notifications and access all historical alert records at any time.
- Log in to the ZAN Node Service Console and click on Dedicated Node in the left navigation bar.
- Under the Solana RPC Node tab, locate and click on the target node.\
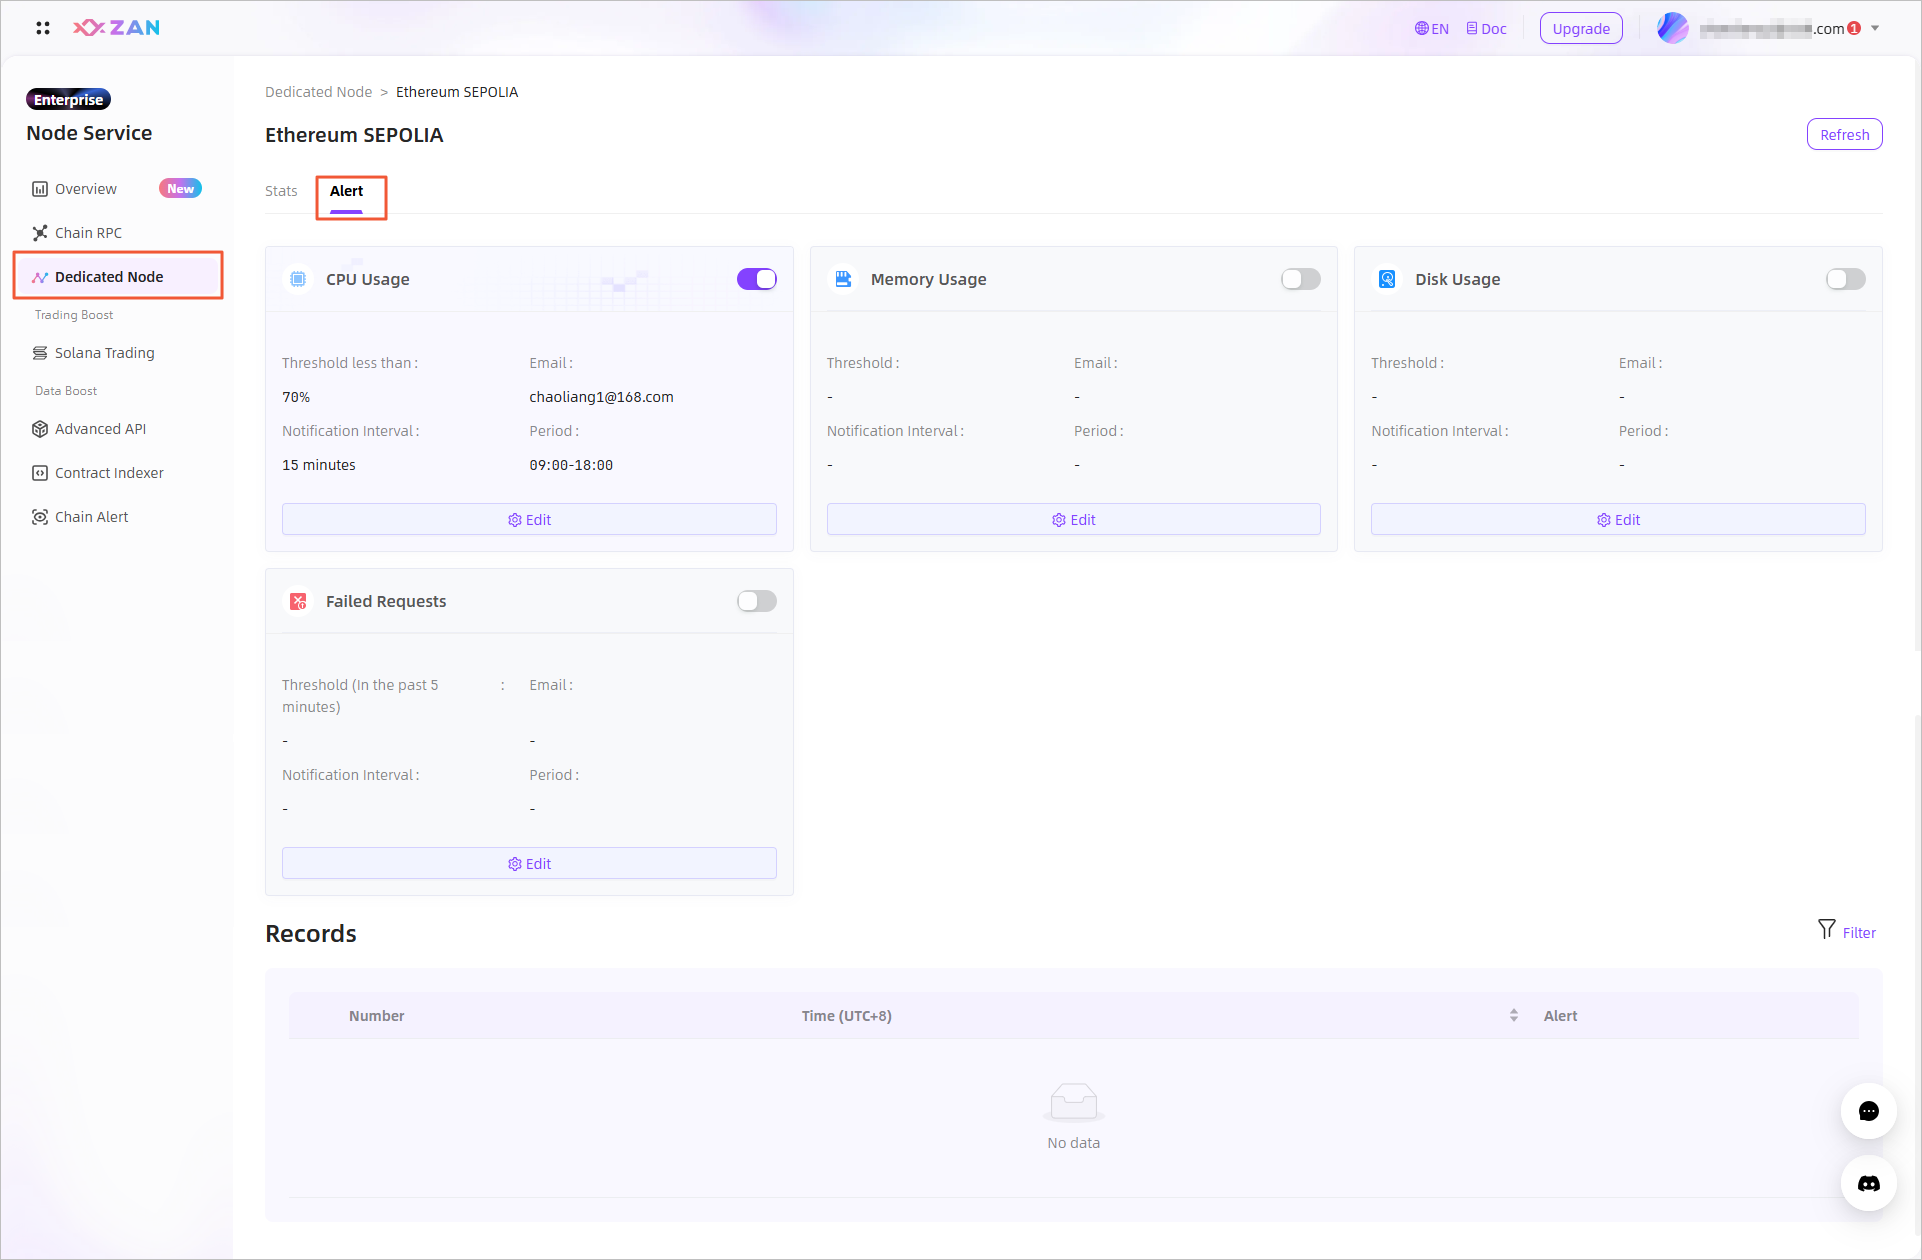
- Switch to the Alert tab, where you can manage the target alert items by performing the following operations:
- Configure alert rules for the target alert item
By clicking the Edit button of the target alert item, you can configure the threshold for triggering alerts, notification interval, email address for receiving alert notifications, and allowed notification periods. Once configured successfully, if this alert item is enabled, the system will automatically trigger alerts according to the current configuration rules.\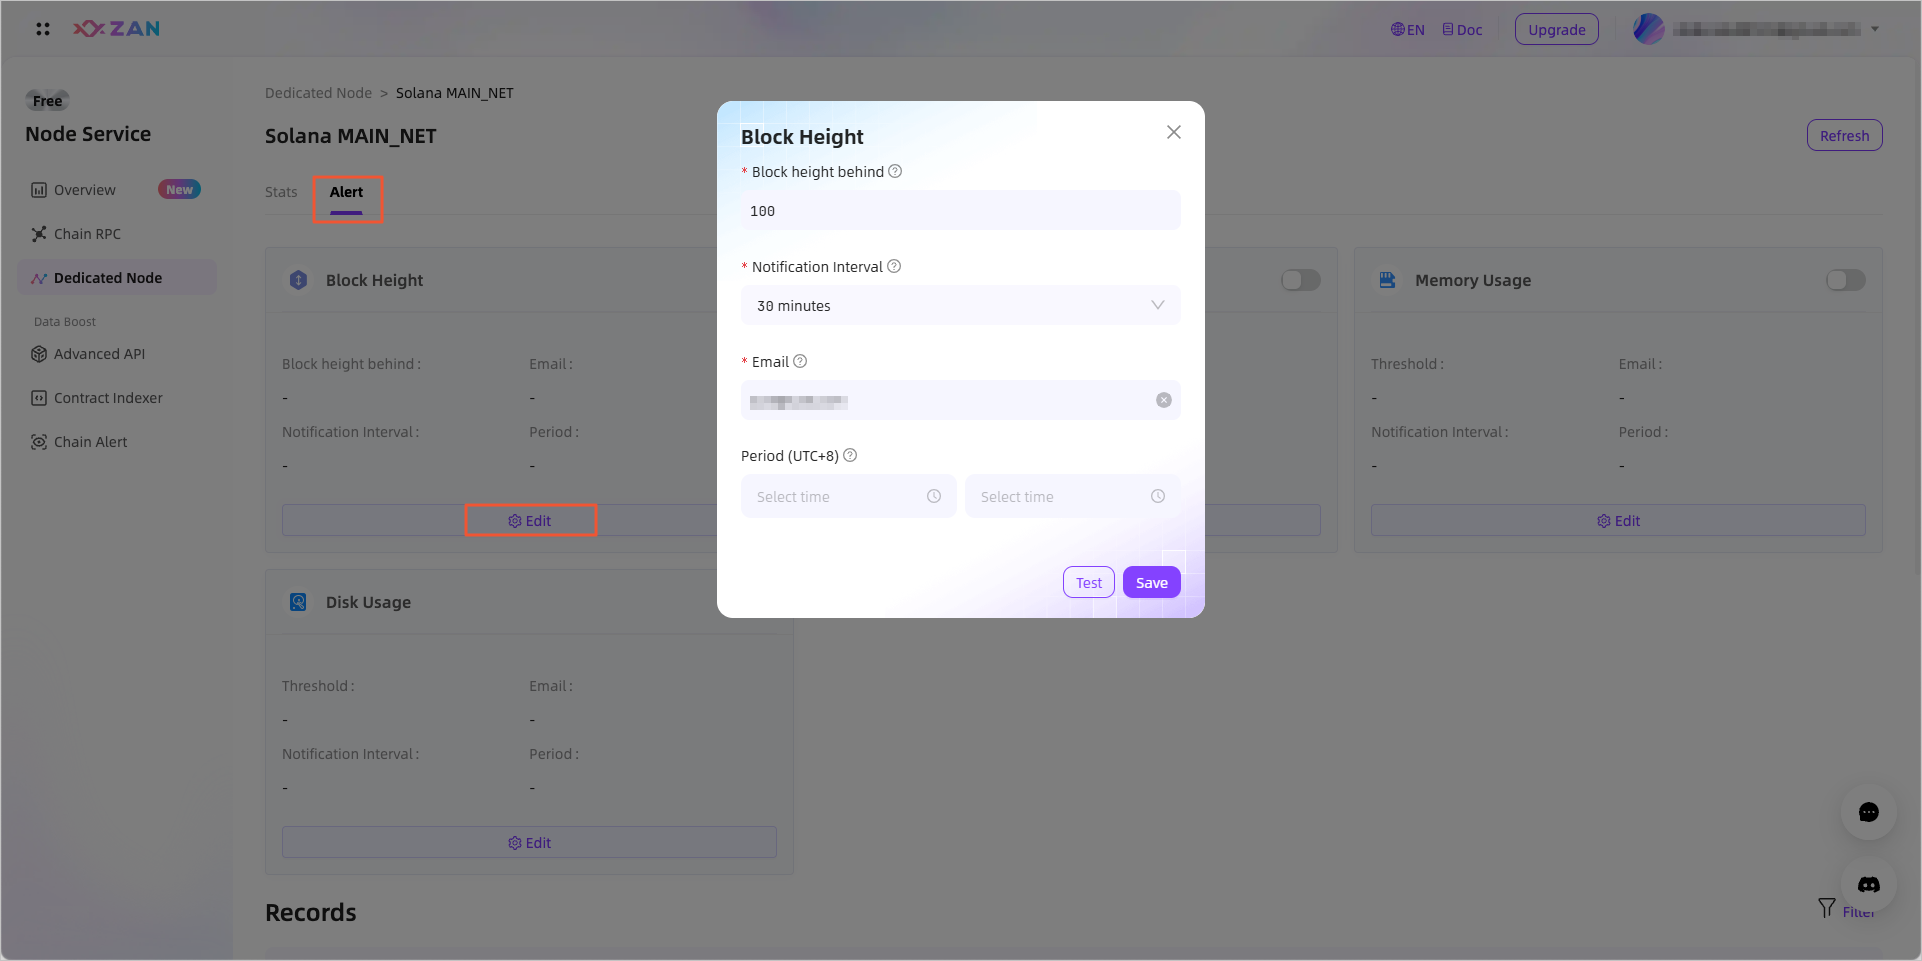 \
\
Note:- In the initial state, since no parameter information has been configured, no alert items are enabled by default.
- After configuring the email, you can test the connectivity of the email by clicking the Test button at the bottom of the pop-up window.
- Enable or disable the target alert item
By clicking the toggle button on the right side of the target alert item, you can enable or disable that alert item.\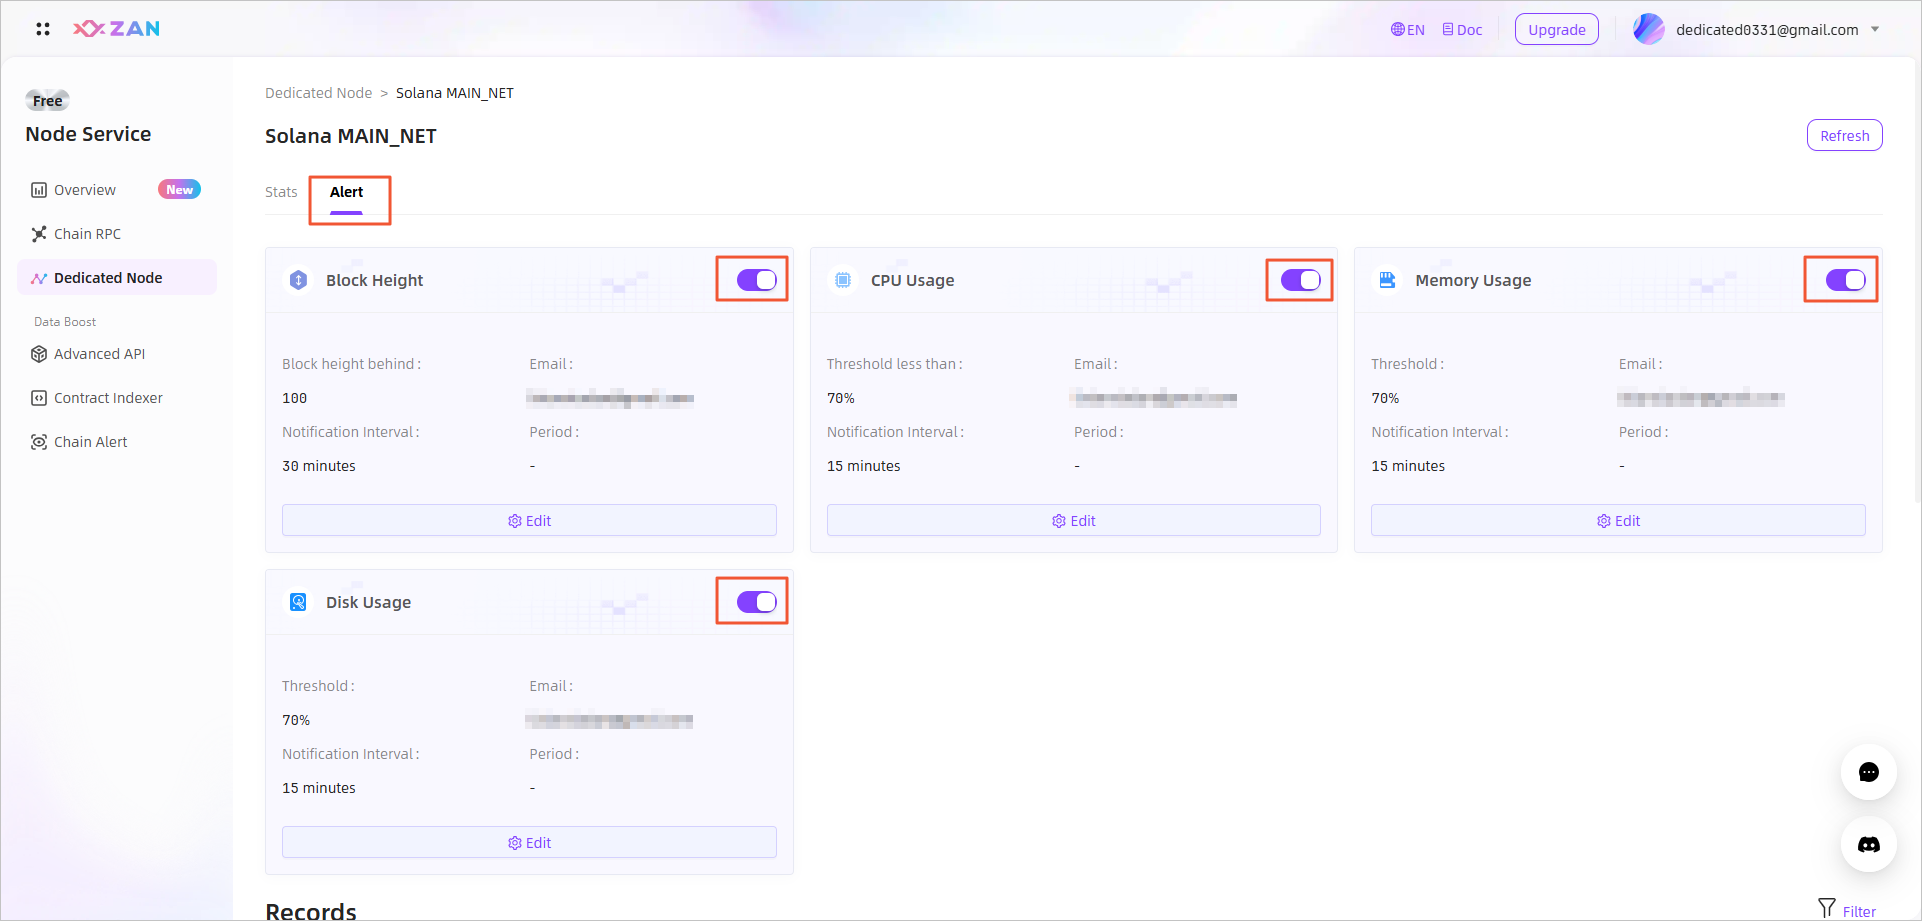 \
\ - View historical alert records
The bottom of the page summarizes all historical alert records, as shown below.\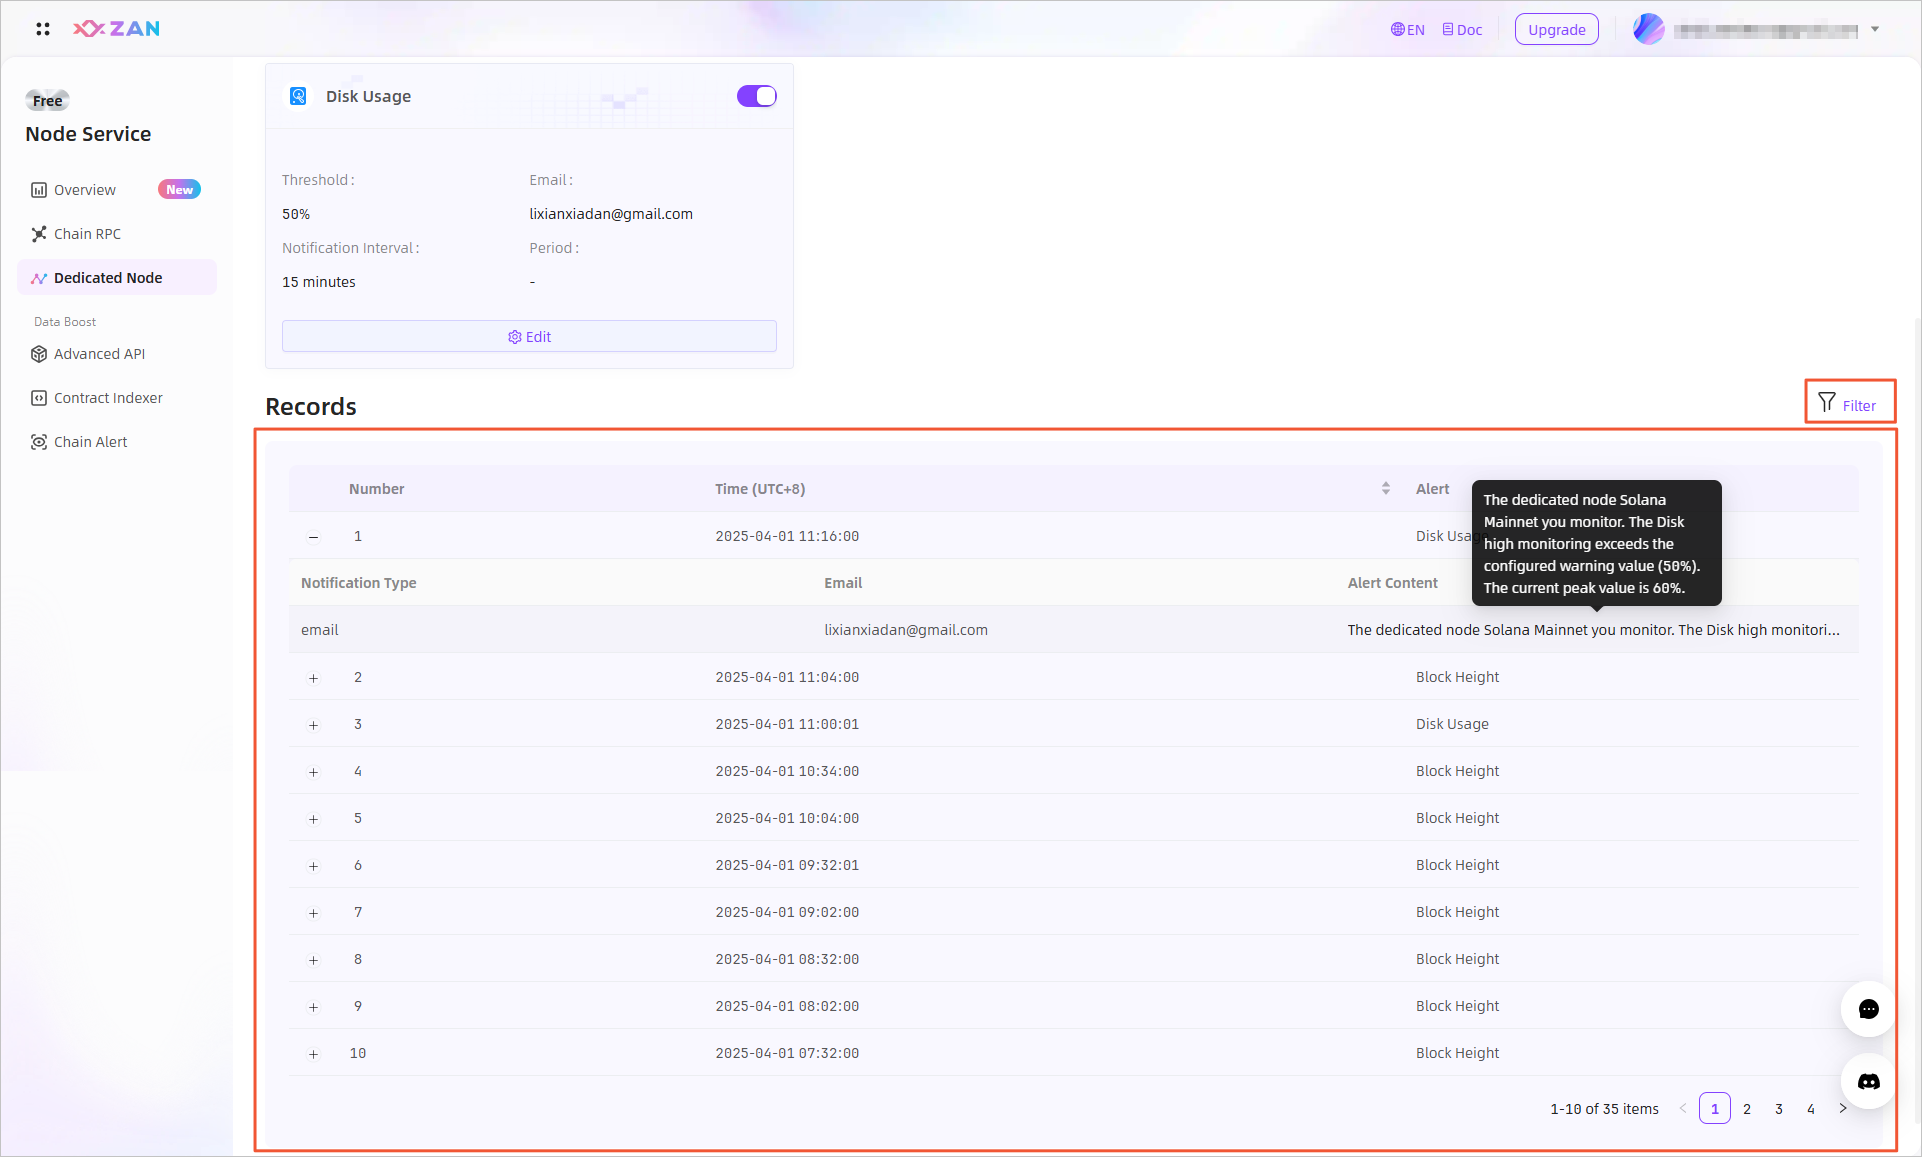
Using the filter on the top right, you can filter out the alert information you are concerned about by combining Alarm Configuration and Data Time.\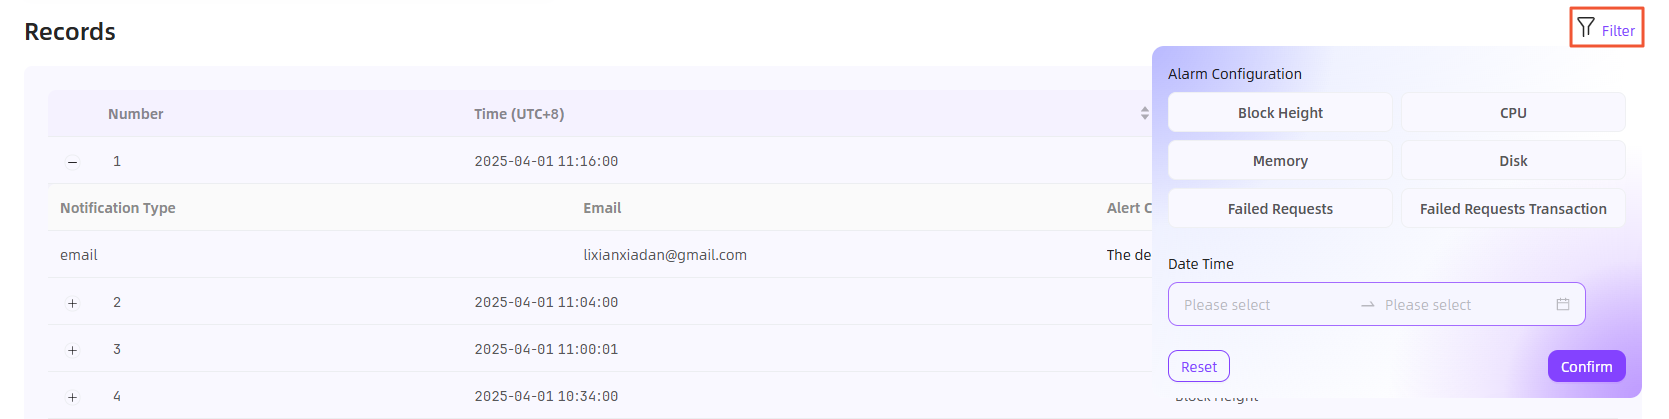 \
\
Note:Solana RPC Node currently does not have alert items for Failed Requests and Failed Requests Transaction.
- Configure alert rules for the target alert item
RPC Node Monitoring
On the Stats tab, you can comprehensively monitor the status of your API key in real time based on the following dimensions: CPU and disk usage (exclusive for dedicated nodes), throughput per unit time, request distribution of top 5 API methods, request status, and request sources. Status monitoring helps you keep abreast of the use and quickly respond.
Overview
Real-time monitoring, all under your control. The customized node service allows you to comprehensively monitor API key status in real time. Specifically, the following modules can be monitored:
- Global Total Traffic Monitoring
The platform supports real-time monitoring of total traffic usage across multiple customized RPC Nodes. - Individual Node Metrics Monitoring
The platform provides real-time tracking of key metrics for individual RPC Nodes, including CPU, Disk, Memory, Traffic Monitoring, Throughput, Requests, Requests Activity, and Requests Origin.
Global Total Traffic Monitoring
- Log in to the ZAN Node Service Console.
- Click on Dedicated Node on the left navigation bar.
- On the RPC Node tab, the system displays traffic usage data for all nodes over the past week by default under the Statistics Analysis module.\
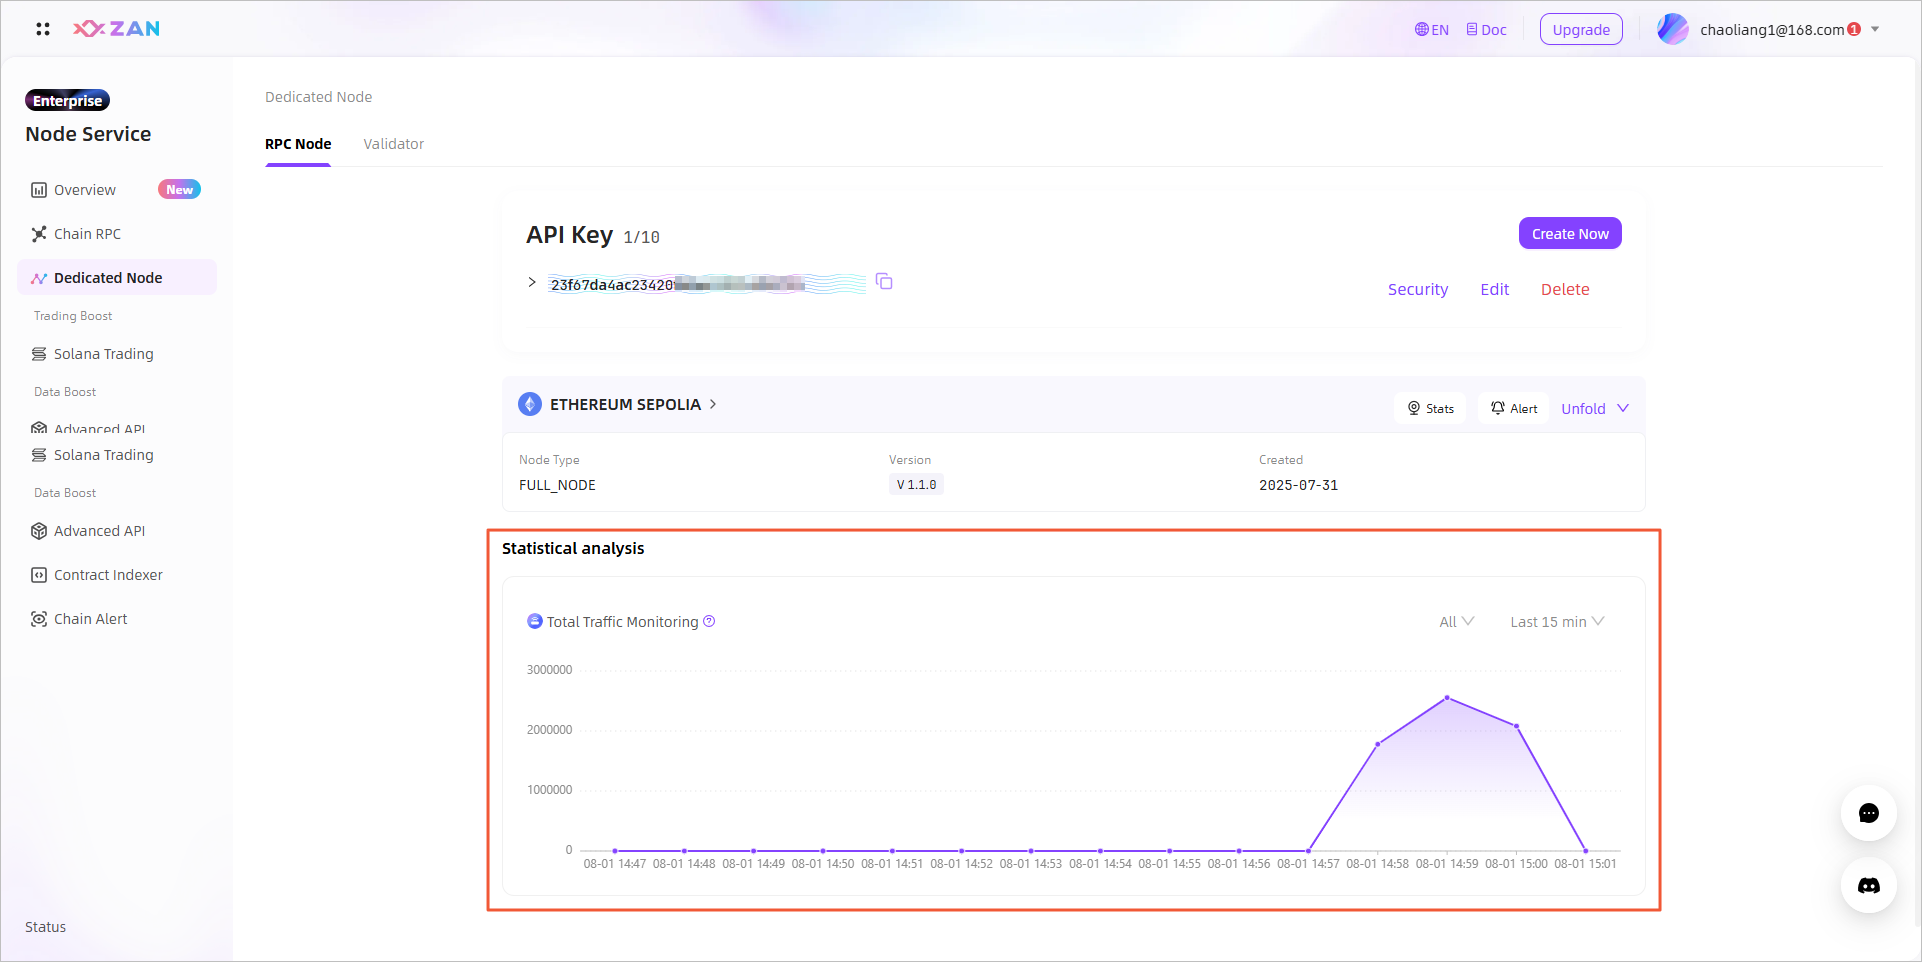 \
\
Note:This module aggregates all traffic data, including gateway records and all communication flows.
Individual Node Metrics Monitoring
-
Log in to the ZAN Node Service Console.
-
Click on RPC Node on the left navigation bar.
-
On the RPC Node tab, locate and click on the target node.
-
On the Stats page, you can comprehensively monitor the status of the API key in real time.\
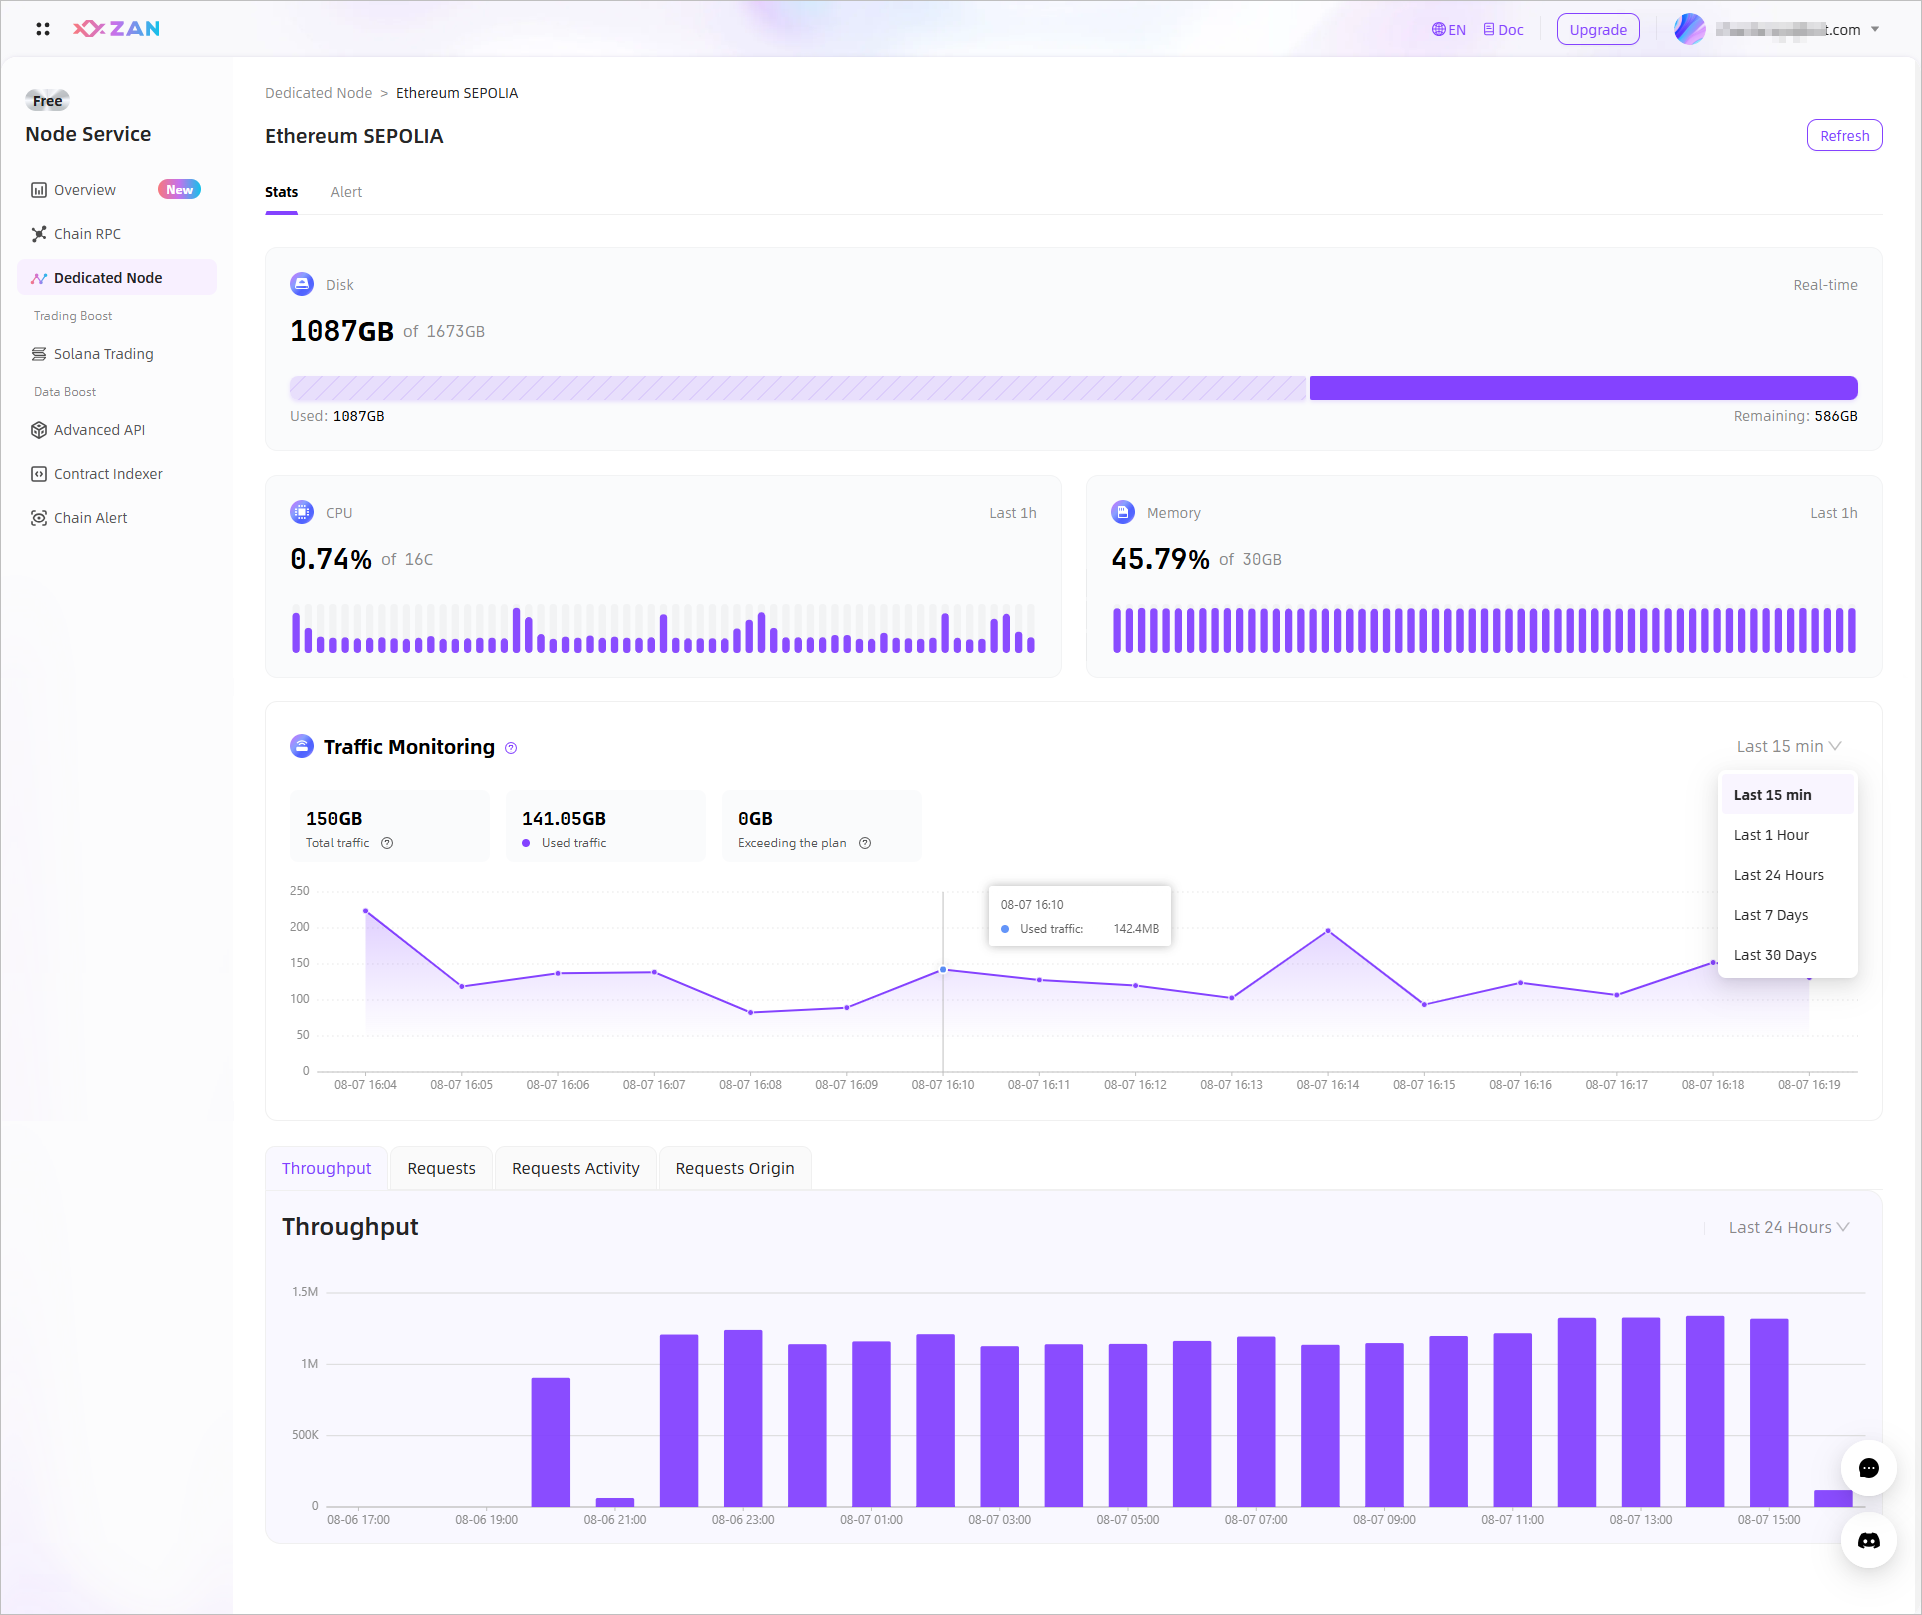
- Disk, CPU and memory usage monitoring
Exclusively to dedicated nodes, monitor the CPU and disk usage percentages of the current dedicated node.- Disk: monitors the disk resource usage of the current dedicated node.
- CPU: monitors the CPU usage of the current dedicated node over the past hour and collects the data at an interval of 5 minutes.
- Memory:monitors the Memory usage of the current dedicated node over the past hour and collects the data at an interval of 5 minutes.
- Traffic Monitoring
Monitors the traffic consumption of the current API key within the last 15 minutes, 1 hour, 1 day, 7 days, and 30 days. - Credit usage fluctuation monitoring
Monitors the resource consumption of the current API key within the last 24 hours. - Request distribution of top 5 API methods
Provides call information and proportion distribution of top 5 API methods that are ranked based on the number of requests within the last 15 minutes, 1 hour, 1 day, 7 days, and 30 days. - Request error monitoring
Provides information about all call requests within the last 15 minutes, 1 hour, 1 day, 7 days, and 30 days, including the status codes to highlight the causes of request failures. - Source monitoring
Provides information about the sources from which API method requests are made by using the API key within the last 15 minutes, 1 hour, 1 day, 7 days, and 30 days.
- Disk, CPU and memory usage monitoring
Manage Alert Notification
You can configure alert notifications for the CPU, memory, disk usage and failed requests of the RPC Node. Once an alert is triggered, you can receive timely notifications and access all historical alert records at any time.
Note:For RPC Node alert configuration and instructions, please refer to the Manage Alert Notification section of Solana RPC Node above.
Updated 3 months ago