Verify Trading Boost
After completing a transaction using one or more levels of Trading Boost, you can go to the Solana's Metrics tab to view the consumption of Points under different levels. Additionally, this tab provides multi-dimensional statistical metrics to verify the on-chain time, success rate, and request volume of the transaction.
- Log in to the ZAN Node Service Console.
- Click on Trading Boost > Solana on the left navigation bar.
- In the Metrics tab, you can view the overall statistical metrics after initiating a transaction with Trading Boosts of different levels.
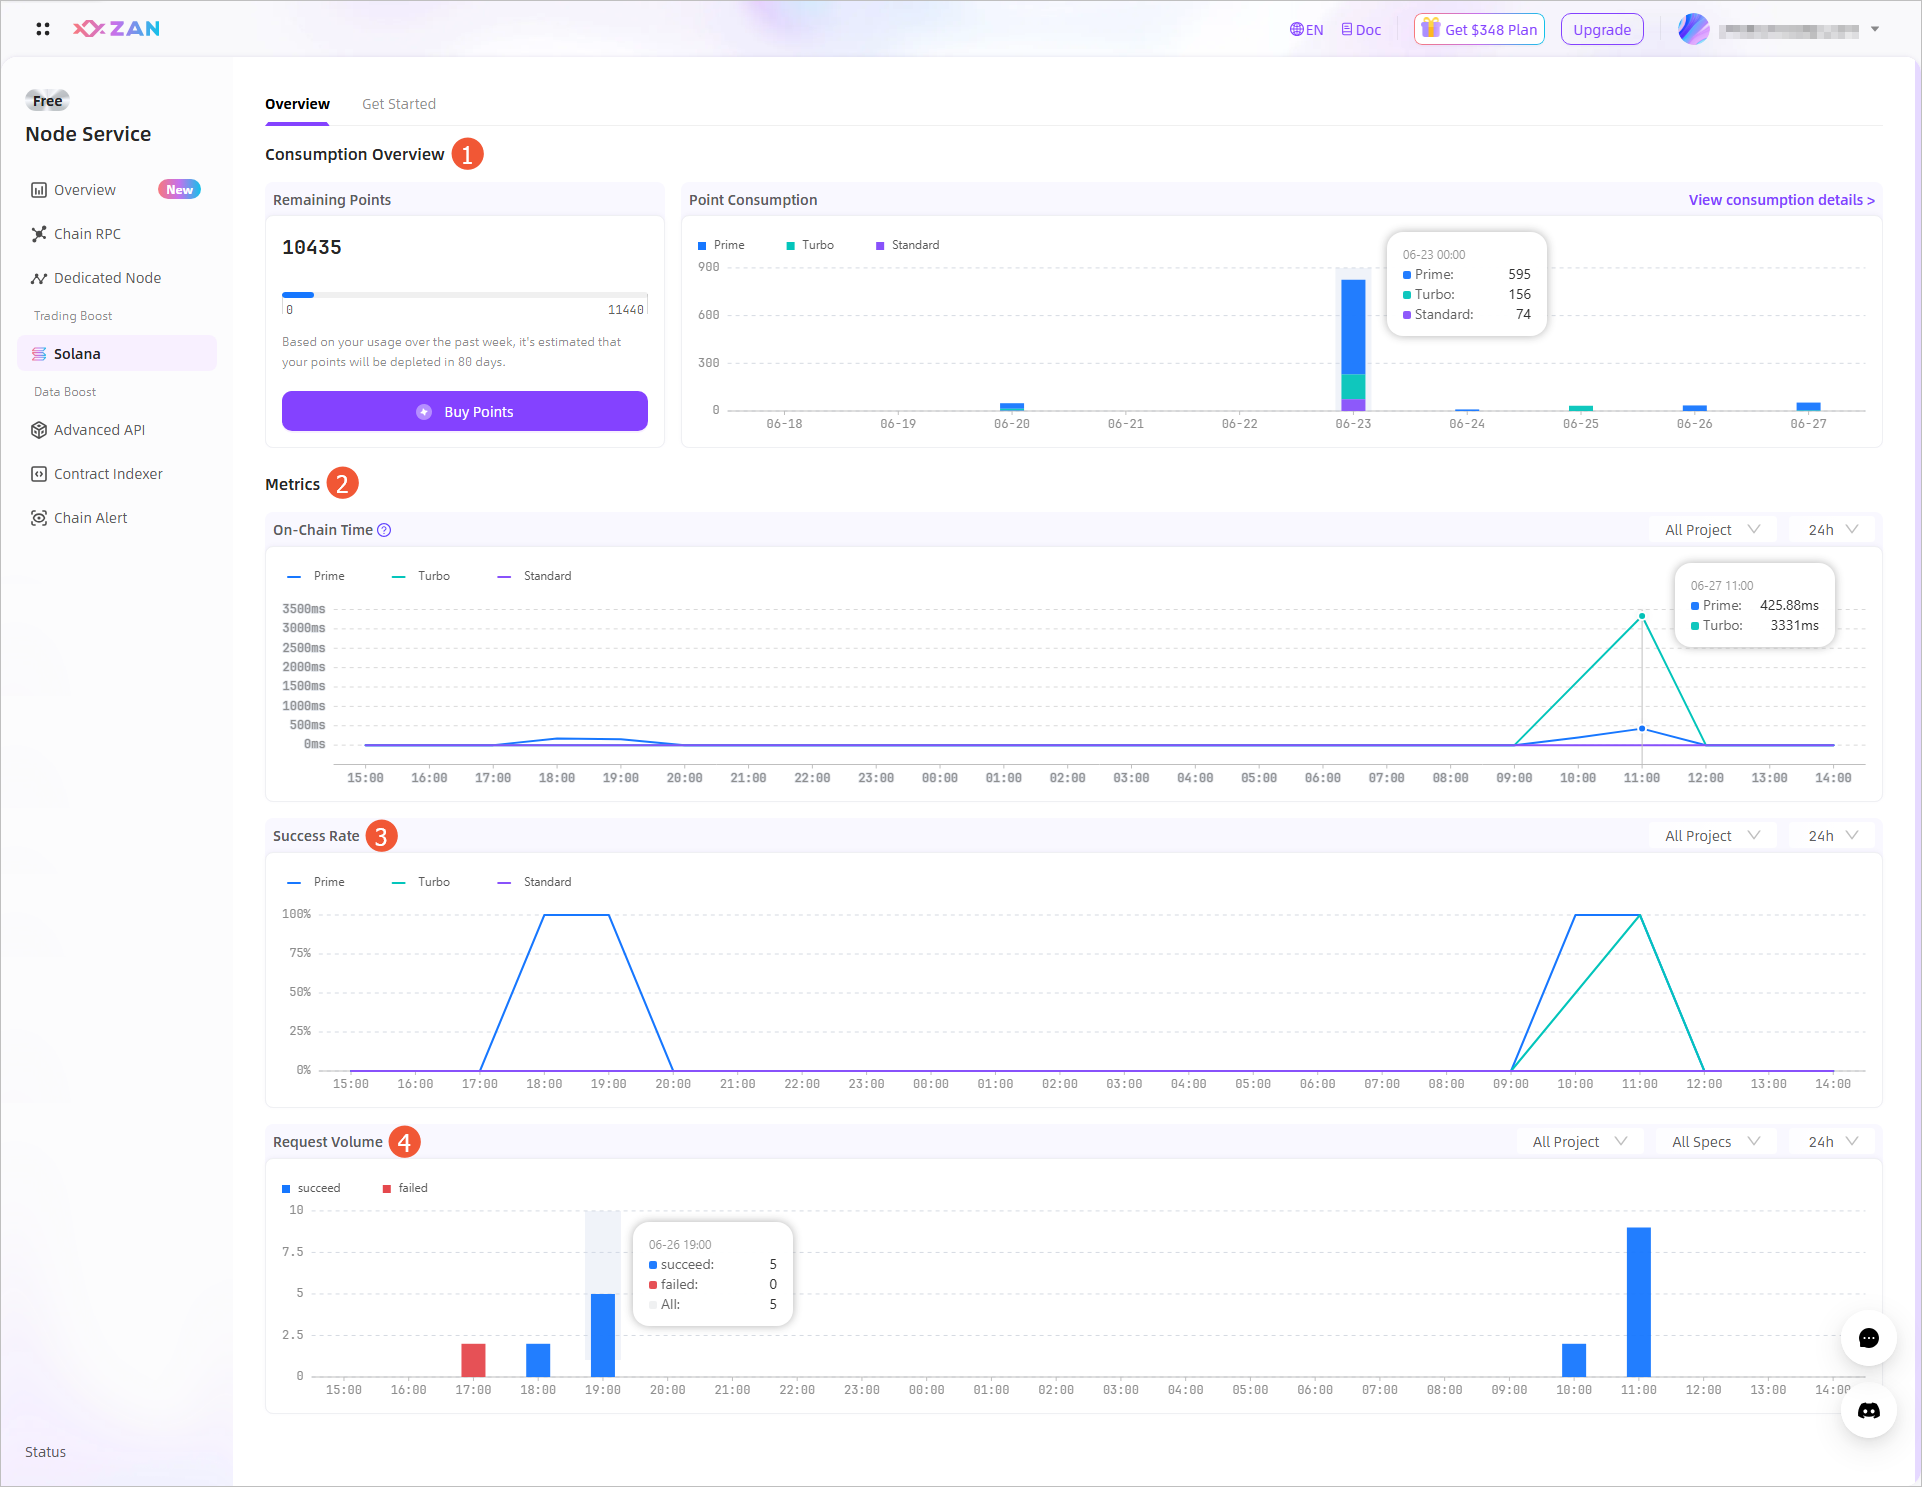
No. Section Description 1 Consumption Overview Display the balance and usage details of Points. If you have not yet purchased Points before, click Buy Points on the card to make a payment and use them. For the purchase guide, please refer to Purchase points. 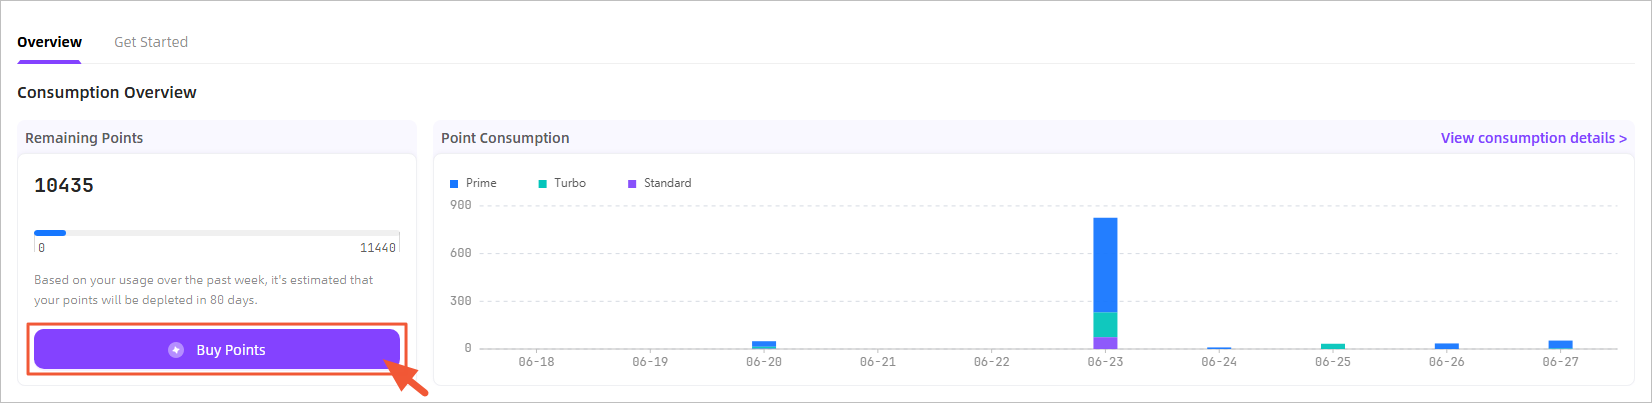
- Remaining Points
Displays the current available Points balance. The platform will estimate the remaining usable days based on your usage over the past week. If the remaining usable days for Points are less than 7 days or the Points have been used up, the platform will give corresponding prompts.
- Point Consumption
Displays the point consumption under different levels, with the last 10 days of data shown by default.
Click View Consumption Details in the upper right corner to view the Points consumption details for each transaction, including Transaction Hash, Block, On-chain Time, Time consuming, Service, and Point Consumption. By default, the system only displays the Point consumption details of all service transactions within the last month. To view Point consumption details for more transactions, you can search for a specific transaction hash in the search box in the upper right corner.
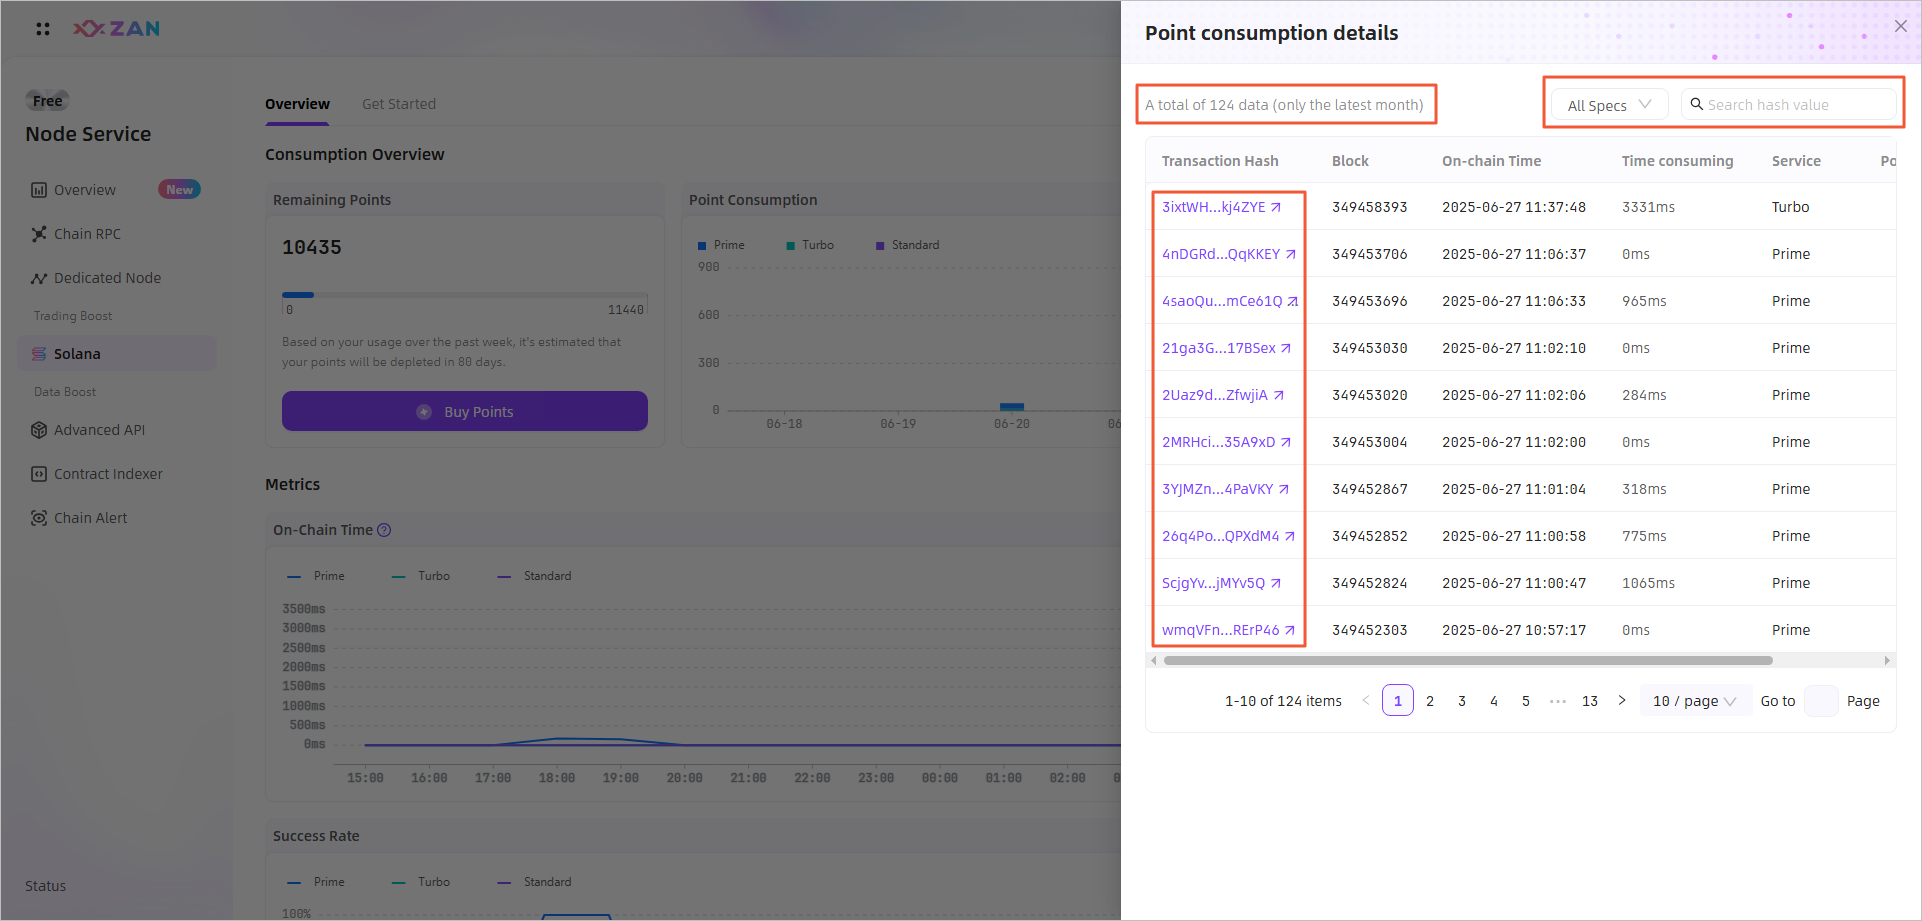
Note:
Click the service filter in the upper right corner to view the Point consumption details for a specific service.
2 On-chain Time Statistics on the average on-chain time of Solana Trading Boosts within a specified time period, displaying the average of all levels on all projects within the past 24 hours by default. - The upper left corner allows you to select and view the on-chain time of a specific level.
- The upper right corner allows you to select and view the average on-chain time of a specific project within the recent 24 hours, 7 days, or 30 days.
- Hovering over a specific point of the target level allows you to view the average on-chain time at that point.
3 Success Rate Statistics on the success rate of Solana Trading Boosts within a specified time period, displaying the average of all levels on all projects within the past 24 hours by default. - The upper left corner allows you to select and view the success rate of a specific level.
- The upper right corner allows you to select and view the success rate of a specific project within the recent 24 hours, 7 days, or 30 days.
- Hovering over a specific point of the target level allows you to view the number of successful transactions at that point.
4 Request Volume Statistics on the requests of Solana Trading Boosts within a specified time interval, displaying the average of successful requests (blue) and failed requests (red) across all levels on all projects within the past 24 hours by default. - The upper left corner allows you to select and view the request volume of successful or failed transactions.
- The upper right corner allows you to select and view the request volume of a specific project, specific level within the past 24 hours, 7 days, or 30 days.
- Hovering over a specific point allows you to view the number of successes, failures, and total requests at that point.
- Remaining Points
Updated 1 day ago